Today’s Guest Post is from Brian Burke. Readers may know Brian from Advanced NFL Stats, a site that provides some of the very best statistical analysis of the NFL. With football season over, Brian has turned his attention to college basketball. He already has a web site set up for college basketball [http://wp.advancednflstats.com/bball]. And this post introduces a very interesting approach to the analysis of this sport. Before getting to the post I want to thank Brian for writing this for The Wages of Wins Journal. Again, I think everyone will find this to be quite interesting.
Although I usually stick to football research, I’ve recently dipped my toe into studying basketball. I’ve built an in-game win probability (WP) model for NCAA basketball. Basically, it takes the score and time remaining from any moment of a game and estimates the chances that each team will win. Although others have developed WP models for basketball before, I’ve gone a step further and created a web site with a live feed that graphs the WP for every game in real-time [http://wp.advancednflstats.com/bball].
In football WP estimates are very useful. Football is a game of strategy decisions such as ‘kick a field goal or go for the first down’, or ‘punt from your end zone or accept an intentional safety’. WP can tell you which decision is usually best and can identify when coaches are making big mistakes. It can also tell you which plays were truly important in any game. Sure, that incredible acrobatic 20-yard reception will make it on Sports Center, but the real ‘play of the game’ was that otherwise unremarkable 5-yard straight-ahead run on 3rd and 4 in the 4th quarter that let the winners burn another 3 minutes off the clock.
To be honest, once I started the WP project for NFL games, it just got to be plain fun. When the season ended I looked around for another sport to model and decided on college basketball.
The WP modeling technique I use is sometimes called an ’empirical matrix.’ I took a set of play-by-play data from recent years of NCAA regular season games 1,782 games from the past 3 years—360 thousand in-game observations in all] and divided it up by home team lead and by time remaining. I simply observed the proportion of times that the home team went on to win the game. Table One presents these observations.
Table One: Home team winning with lead at different points in a college basketball game
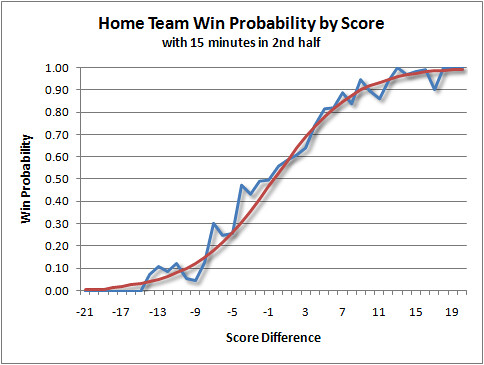
With enough data, that’s almost all you have to do. But because of limited sample size in many of the cells (there may not be many combinations of 17 point leads with 19 minutes to play), the results will be somewhat noisy. To reduce the noise, I used logistic regression. For each minute of time remaining, I ran a regression using the current score difference to predict win probability for the home team. Graph One illustrates an example of the raw, unsmoothed data and the resulting regression estimate:
Graph One: Home Team Win Probability.
Here is what a typical game’s WP timeline looks like. This is the recent Villanova-Notre Dame game:
Graph Two: Villanova vs. Notre Dame
One thing I’ve already noticed that’s interesting about basketball is that the win probability equation is the same for nearly the entire game. In other words, a 6-point lead for the home team in the first 10 minutes of the game yields the same WP of 0.86 as a 6-point lead with 10 minutes to go in the 2nd half.
This surprised me. I would have expected any certain lead to be more decisive as the game went on, gradually becoming more and more insurmountable. In the graph I cited above, the “slope” of the curve would theoretically get steeper and steeper as the game goes on. When I went to make a graph of selected times in the game to show how the curve steepens, I could only see a single curve. I thought I had made some kind of error in Excel, but the curves were just superimposed. Not until the final couple minutes do the curves become very steep, when ultimately a 1-point lead with zero seconds remaining is as decisive as a 10-point lead.
Although basketball doesn’t have the same strategy elements as football, there are some interesting potential applications of WP in Dr. Naismith’s creation–when to start fouling, when to slow down the game, the value of simply possessing the ball, or how much the ref’s bogus call really swung the game.
I can’t answer all those questions just yet, and I should probably leave that stuff to the basketball experts. But I’ve already learned a lot, particularly from a comparative-sports perspective. Just as learning a foreign language helps one more thoroughly understand your own language, to truly understand a sport one should understand how it differs from the other sports. I’d like to improve the model in some ways, particularly with respect to non-continuous considerations in the crucial final minutes. For example, a 4-point lead is more than 33% better than a 3-point lead because the game is essentially out of reach of a single possession. I might also like to include factors such as penalty bonuses or time outs remaining.
I should also note that the model is generic. Even if my team, Navy, were playing at Duke, my model would yield the same WP estimate as for any two other teams. There are ways to factor in team strength, but a generic model is a good baseline for now.
I thought I’d share this with hard core basketball stat-heads out there, and I figured this would be a good place. Thanks to Dave for allowing me to post here. And yes…I’ll probably have an NBA version up and running in time for the playoffs.
Brian Burke


Jeff
March 6, 2009
Two questions regarding the approach:
1. Did you do any subsampling in order to get out-of-sample forecasts?
2. Any goodness-of-link testing? Koenker has been working on a functional form diagnostic for binary limited dependent variable models that is similar to Box-Cox. It would probably be too much hassle for this exercise, but a goodness-of-link test would be useful and not terribly computationally demanding.
Brian Burke
March 6, 2009
Jeff-No, nothing so rigorous. I did some basic bootstrapping by month to see how consistent the win rates are, and to see if there is any bias in home court advantage by month. I just eyeballed the numbers and graphs to make sure I had more than enough data.
Phil
March 6, 2009
Excellent read, Brian. I’m also quite surprised that leads are statistically identical regardless of game time (to an extent).
One possible explanation: A team that goes up six points early is usually indicative of one team being a lot better than the other. On the other hand, being up six points late indicates that the teams are evenly matched.
If you’re up 6 points with three minutes remaining, that’s a very sizeable lead, even if you are equal to your opponents in all other respects.
If you’re up 6 points three minutes into the game, then you’re probably going to win, because going up that much early tend to indicate that you’re much better than your opponent.
Or so I assume.
workingsforsuckers
March 6, 2009
Cool model, can I ask were you got the raw data?
Larry Fall
March 7, 2009
I would think that one key factor that should be considered, at least near the end of the game, would be who has the ball. I would think that being up three with the ball with a minute to go is significantly different than being without the ball.
I’d be very curious to know at what point having possession of the ball actually starts to matter?
Brian Burke
March 7, 2009
Larry-That’s very true. Unfortunately, the game reports don’t report who has possession, nor are they quick enough to track possession closely.
Also, the play-by-play logs commonly available aren’t detailed enough to always know who has the ball. Often it can be deduced, such as immediately following a basket or foul, but not always.
But I do have a work-around. Every possession has a probability distribution of outcomes: 0, 1, 2, or 3 points (and sometimes 4). So I can use a Markov-like process to estimate the WP for each of those outcomes and then total the probabilities.
For example, Team H is leading Team V by 3 points. If H has the ball, there’s a 10% chance of scoring 1 point, a 36% chance of scoring 2 points, and a 9% chance of scoring 3 points. [I’m not confident in these %s yet and they likely change as a function of lead and time remaining, so I haven’t implemented anything so far.]
I can roll up the total weighted probabilities for each of the potential game states: up by 3, 4, 5, and 6. Then I’d have a WP for Team H when they have the ball. So I’d report a baseline WP for each team, then a “with the ball” adjustment, say +0.03 or something, for each team.
I’ve already experimented. I’ve noticed a couple things. First, it’s asymmetric. Possession is more valuable for the team behind than the team ahead. So if the WP is currently .20/.80, possession for the losing team makes it .25/.75 while possession for the winning team makes it .18/.82 (or so).
Also, the effect is iterative. In other words, possession for Team H gives them a +0.03 boost, but if they do score, that means Team V will get the ball right away, swinging the advantage of possession right back the other way.
wfs-I got the data by parsing it from freely available online sources. Play-by-play game logs for many NCAA games are available from espn.com, yahoo.com, and cbssports.com.
Will Dwinnell
March 8, 2009
Is there any possibility of your providing the counts behind that table?
I am thinking of two other tables, with the same ‘min. remaining’. ‘Home team lead’ format: one for total observations per cell, and another for total home team wins per cell.
Mark
March 8, 2009
Do you have a place on the site where you can input the time remaining and points and get a probability for a general game?
Sam Cohen
March 8, 2009
Are your model and the one Jeff Ma uses basically doing the same thing?
http://myespn.go.com/blogs/truehoop/0-25-36/Your-Team-s-Chance-of-Winning–Moment-by-Moment.html
Brian Burke
March 8, 2009
Sam-Yes, it looks very similar. It appears ProTrade’s model was an generic empirical model also–but for the NBA. Ed Kupfer had a similar model for the NBA a couple years earlier.
I’m not sure about ProTrade, but Kupfer’s model used a much more convoluted regression model. His description was something like, “I’m not sure why this particular equation works, but it’s kind of close to what we actually observe.” That’s fine, but he’s looking for a single unified-theory-of-basketball equation. I’m not as ambitious–I just have 40+ different equations, instead of one unified one.
I think ProTrade (Ma) has since abandoned its win probability efforts.
Brian Burke
March 8, 2009
“a generic…” not “an…” sorry!
Dean Abbott
March 8, 2009
Very interesting analysis–thanks for sharing it.
From a strategic perspective, one thing I would be interested in (and would love to do) is some conditional statistics: what characteristics exist that are most associated with teams coming back to win, say with 15 minutes left in the 2nd half? One simple way to do it would be to take your logistic regression model, bin it into deciles (10% probability bins), and then build something like a decision tree to discover rules that associate with each bin (rather than looking at average trends over all the data).
Christopher
March 11, 2009
Brian,
A nice informative read. I think the poss aspect would pan out as you described, that is, it bounce back and forth and is probably not worth explicitly modeling because of that. Also, I think you already have SOS. A top tier vs bottom-feeder team would be reflected in the score, which is an input. So I think your fine. But, then again, I really value parsimony in modeling. I am curious about home vs neutral vs away games. On one hand this is important in college basketball. But, on the other hand, I’m not sure how much of an issue it is. Perhaps some form of stratification? But this seems problematic as one team’s home is another’s away. For neutral site games this would be possible however.
Let me caveat the poss aspect: As poss get scare relative to score margin and time remaining I can see these getting important. It’s as if you need a different analysis for “crunch time.” Say, spread is 6 pts or less with less than 5 minutes left?
David
March 11, 2009
Brian,
How about making a top-10 list of the greatest comebacks of all time, measured by probabilistic deficit?
Brian Burke
March 11, 2009
Christopher – You’re right about team strength. A lead at any point in the game gives us 2 pieces of information. One is the deficit that the trailing team needs to overcome. The other is a signal about the relative strength of each team.
David-I’d love to do that. As a Terps fan, one of the tops has to be the 2000 Final Four game when Duke came back from a huge lead (with some help from the men in stripes) to beat Maryland. But I’m probably going to do a project like that for the NFL before I do anything else.
Dean-I don’t have much info beyond the basic play by play description, so it would be hard to find certain rules that associate with comebacks. That would be very time consuming. I’d be happy to share the data if someone’s interested.
Will Dwinnell
March 15, 2009
I get the feeling from the above description (though this is not stated explicitly), that the logistic regressions were run on the summarized data. In other words, the number of wins were divided by the number of games in each cell, then these win rates were fed to the regression.
If so, this is fine, but there is a subtlety: the regression can be run on the data as-is, or it can be “weighted” by the number of observations (games) in each cell. Just using the win percentages causes the regression to try to minimize the error in all cells equally, whereas weighting by the number of games makes the regression may attention to cells which come up more of the time.
Brian Burke
March 15, 2009
Will-You’re dead on. The regressions were not weighted. I did test for differences on a couple of the runs, and there wasn’t anything noticeable. It became fairly time consuming, so I left the data unweighted for now.
But in my NFL model, I do exactly what you suggest. But because football scores are so “chunky” (3 & 7 point scores typically), I use LOWESS (locally weighted) smoothing instead of a logistic regression.
Bart
March 15, 2009
“For example, Team H is leading Team V by 3 points. If H has the ball, there’s a 10% chance of scoring 1 point, a 36% chance of scoring 2 points, and a 9% chance of scoring 3 points. [I’m not confident in these %s yet and they likely change as a function of lead and time remaining, so I haven’t implemented anything so far.] ”
Have you found (or looked for) a correlation between overall team 3 point percentage and the ability of a team to come back?
Or once it gets late in the game, is there no difference between a team that has a season-to-date 3 PT % of 30.0 vs. 35.0?
On another topic, you mentioned that you broke the data down by month.
I was wondering if you had any data on number of possesions per game, broken down by month.
Do the number of possessions per game change at all as the year progresses?
Or, in tournament time, do teams have fewer (or greater) number of possessions per game, meaning that each possession could vary in importance? This could vary by team, so not sure if you have the data to see if, for example, slow-paced teams get even slower-paced?
Thanks,
Bart
Phillip
January 3, 2011
Would you please share the play-by-play data you amassed?